
The monthly report lands in your inbox. Twelve pages. Charts going up and to the right. “10 conversions at $30 each!”
But you only remember two new customers last month.
Both can be true. Marketing reports often count different things than you do, and a report that doesn’t say what it’s counting can make a so-so month look great, or a good month look bad.
A useful report should take you five minutes to read and end with a decision. Here’s what it should include, and the red flags that tell you it doesn’t.
The five questions every report should answer
| Question | What a good answer looks like | What a weak answer looks like |
|---|---|---|
| What did we spend? | Ad spend, management fee, design and software, listed separately, for a clearly stated month | “Ad spend: $300” with nothing else |
| What did we get? | Inquiries, qualified inquiries and new customers, counted from your records | “Conversions: 10” with no definition |
| What does each number mean? | “A conversion is a completed form or a call longer than 60 seconds” | No definitions anywhere |
| What changed and why? | “Leads fell after the offer expired on the 14th” | “Performance fluctuated” |
| What happens next? | “Pause the out-of-area towns by Friday. Owner: Sam.” | “Continue to optimize” |
If your report can’t answer the first two in one sentence each, it’s not ready for you to make decisions with.
The same $300, three different prices
Meet Example Dental, a made-up dental practice in Haddonfield. (The practice, its numbers and its report are fictional. They’re here to show the method.)
Last month, it spent $300 on Google Ads. Its ads were seen 2,000 times and clicked 100 times. That’s a 5% click-through rate and $3 per click.
The ad platform reported 10 conversions. But when the front desk checked, there were only 6 real new-patient inquiries, and 2 became new patients.
So what did a new patient cost? It depends on what you divide by:
| What you divide $300 by | Count | Cost each | What it really describes |
|---|---|---|---|
| Platform-reported conversions | 10 | $30 | Every event the platform counted, including duplicates and short calls |
| Real inquiries the office verified | 6 | $50 | People who actually reached the practice |
| New patients | 2 | $150 | People who booked and showed up |
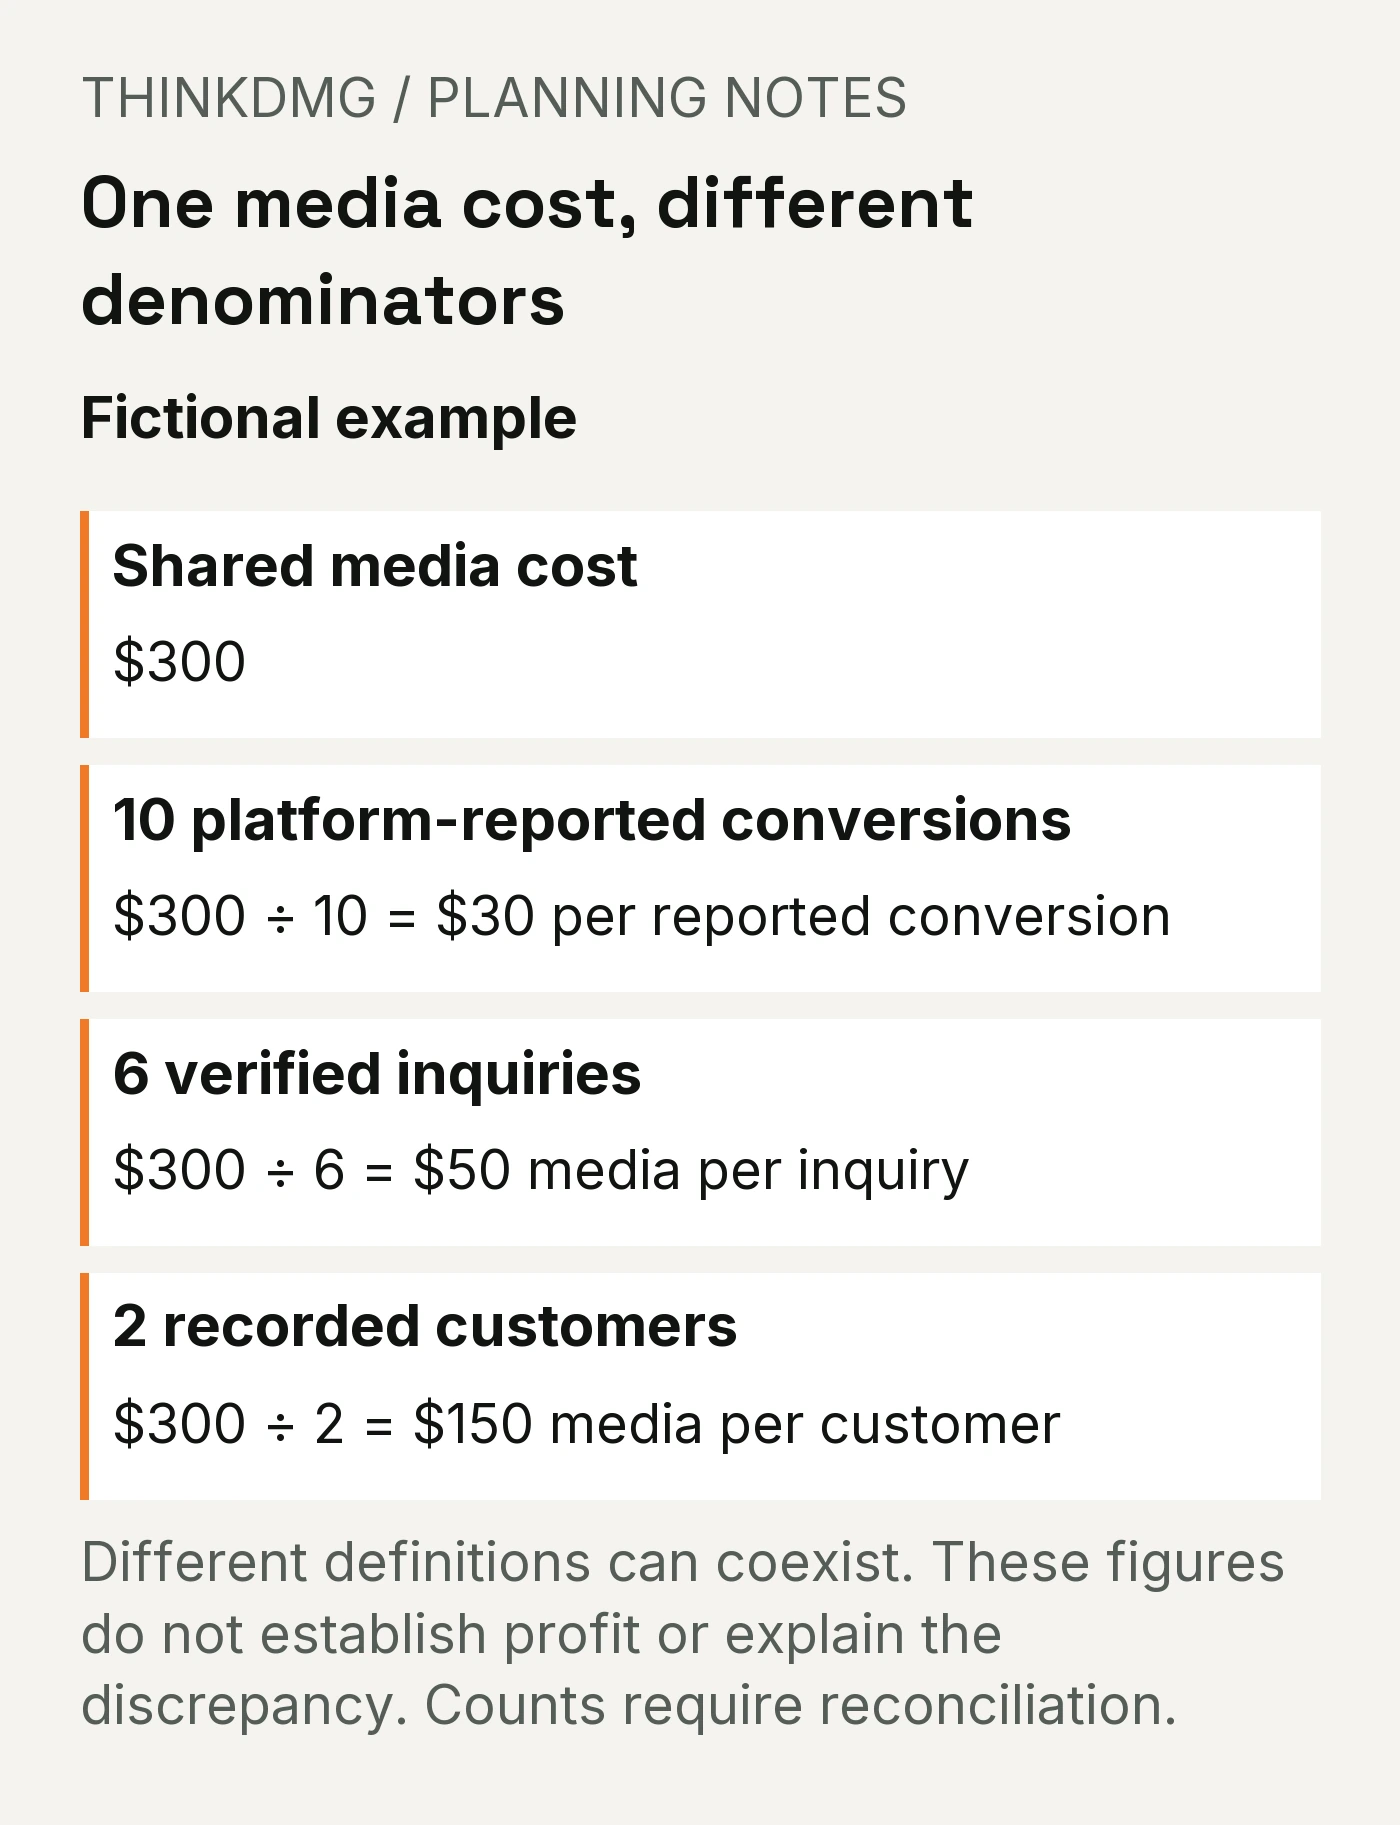
All three numbers are correct. Only one tells the owner what a new patient cost in ad spend. The report led with $30.
Why your numbers and the ad platform’s never match
Three reasons, and none of them mean anyone is lying.
| Reason | What happens | What to ask for |
|---|---|---|
| Different definitions | The platform counts a phone-number tap as a conversion; your office counts a real conversation | A written definition of every conversion in the report |
| Duplicates | One person fills out the form twice, or calls and then fills out the form | A count of unique people, not events |
| Credit sharing | Someone saw a Facebook ad, then searched Google, then called. Both platforms may claim them. | Which attribution method the report uses |
That last one has a name. Google defines attribution as the act of assigning credit for important user actions across the steps a customer took. Different tools assign that credit differently, so a report should say which method it uses. It shouldn’t imply the last ad someone clicked did all the work.
Comparing months without fooling yourself
“Spend was up 50%!” sounds like a lot. Here’s what to check before reacting:
| Check | Example | Why it matters |
|---|---|---|
| Same length of time | Compare 30 days to 30 days, not a 31-day month to a 28-day one | Extra days mean extra leads, not better marketing |
| Same definitions | Was “conversion” defined the same way both months? | A tracking change can create a “jump” overnight |
| Real counts, not just percentages | Spend went from $500 to $750, so up 50% | The count tells you the size; the percentage alone can mislead |
| Zero to something | Last month: 0 leads. This month: 3. | There’s no percentage increase from zero. Report the counts. |
| What else changed | A new offer, a holiday, a competitor’s sale | The report should name it, not let it pass as “optimization” |
A sample one-page owner report
Here’s what Example Dental’s report should look like instead of twelve pages of charts. Bring a version of this to your next agency meeting and ask for it every month.
| Example Dental: October ads report | |
|---|---|
| Period | October 1 to 31 (31 days) |
| Spent | $300 ad spend + $400 management = $700 total |
| Reported conversions | 10 (form fills plus calls over 60 seconds) |
| Real inquiries (checked by front desk) | 6 |
| New patients booked | 2 |
| Ad cost per new patient | $150 |
| Total cost per new patient | $350 |
| What changed | Two inquiries came from towns outside our area after the location setting widened on Oct 12 |
| Still unknown | Whether the 2 patients from late October will book follow-up visits |
| Next step | Narrow ad locations back to our 8 towns by Nov 3. Owner: agency. Review Nov 30. |
Fictional example. The format is the point: every number defined, every cost included, and a decision at the end.
Notice the total cost per new patient. It’s more than double the ad-only number. If you only ever see ad spend, you’ll never know what a customer really costs.
Red flags in a marketing report
| Red flag | Why it’s a problem | What to ask |
|---|---|---|
| “Conversions” with no definition | Could mean anything from a button tap to a booked job | “What exactly counts as a conversion?” |
| Impressions and clicks up front, customers nowhere | Activity isn’t results | “How many new customers came from this?” |
| Only ad spend shown | Hides the real cost per customer | “What’s the total cost, including your fee?” |
| Percentages with no counts | “Up 200%” might mean 1 lead became 3 | “What are the actual numbers?” |
| No “what’s next” | You’re paying for a report, not a plan | “What will you change, and by when?” |
| ROI with no explanation | Revenue divided by ad spend isn’t profit | “What costs and revenue went into that number?” |
| The same report every month | Nobody is reading or acting on it | “What did we learn this month that we didn’t know last month?” |
What we check first
Here’s our approach at ThinkDMG. When a business asks us to look at its marketing reports, we start with three questions:
- Does the number of “conversions” match the number of real inquiries in the office? If not, find out why before judging anything else.
- Is the total cost shown, or just ad spend? The real cost per customer includes everything.
- Does the report end with a decision? If nobody can name the next step, the report isn’t doing its job.
Your blank one-page report template
Ask your agency (or yourself) to fill this in every month.
| Report line | This month |
|---|---|
| Period (exact dates) | |
| Ad spend | |
| Other costs (management, design, software) | |
| Total spent | |
| Reported conversions (with definition) | |
| Real inquiries (counted by your team) | |
| New customers | |
| Ad cost per new customer | |
| Total cost per new customer | |
| What changed and why | |
| What’s still unknown | |
| Next step, owner and date |
What to do next
Once you know your real cost per customer, compare it with what you can afford to pay for a lead. If reported conversions are high but customers are low, the problem may be after the form. See getting leads but no customers.
And before you act on a “winning” change in the report, make sure it was a fair comparison. Our guide to testing one change at a time shows how.
When should you ask a marketing agency for help?
You can read a report yourself. Get a second set of eyes if:
- Your report says “conversions” and nobody can tell you what that means
- The agency’s numbers and your office’s numbers never match
- You’ve never seen your total cost per customer
- You get the same report every month and nothing changes
- You’re about to renew a contract and aren’t sure what you’re paying for
Digital Marketing Group works with home services and local businesses across South Jersey and Greater Philadelphia on paid advertising, conversion tracking and reporting that ends with a decision.
Frequently asked questions
What should a small business marketing report include?
At minimum: what you spent (all costs, not just ads), what you got (inquiries and customers counted the way your business counts them), a definition of every number, what changed and why, what’s still unknown, and a specific next step with an owner and a date.
Does a conversion mean a new customer?
Not necessarily. A conversion is whatever the ad platform was set up to count, which might be a form fill, a phone-number tap or a call longer than a set time. Ask for the written definition, and compare conversions with the real inquiries and customers your team recorded.
Why don’t my ad platform’s numbers match my own records?
Usually because of different definitions, duplicate submissions, or two platforms claiming credit for the same customer. None of these mean anyone is lying, but your report should explain which definitions and which attribution method it uses.
What is a good cost per lead?
It depends on what a customer is worth to you, not on someone else’s benchmark. Work out what a customer leaves you after the cost of the job, and how often your leads become customers. Our lead cost guide and free Lead Cost Calculator walk through the math.
How often should I get a marketing report?
Monthly works for most small businesses. What matters more is that each report ends with a decision. A weekly report that nobody acts on is worth less than a monthly one that changes something.
Sources
- Google Analytics Help: Get started with attribution. Defines attribution as assigning credit for important user actions, and describes attribution models as the rules or algorithms that split that credit across touchpoints.
About the numbers: Example Dental and every figure in this article are fictional, used to show the method. They are not benchmarks or ThinkDMG client results.
