
A cheap lead can be expensive.
A $20 lead that never turns into a job costs you $20 and an hour of your office’s time. A $60 lead that turns into a $1,000 job one time in four might be the best money you spend all month.
So “what’s a good cost per lead?” doesn’t have one answer. It has your answer, and you can work it out in about ten minutes with four numbers you already know.
Meet Example Plumbing
Example Plumbing is a made-up plumbing company in Voorhees. (The company and every number here are fictional. They’re here to show the method, not to set a benchmark.)
Its bread-and-butter job is a water heater replacement. The owner is getting offers from two lead sources: one charges $25 a lead, the other $45. Which is the better deal?
He can’t tell until he knows his number.
Step 1: Start with what a job leaves you, not what it brings in
A water heater job brings in $1,000. But that’s not what he has to spend on marketing.
| Example Plumbing’s typical job | Amount |
|---|---|
| What the customer pays | $1,000 |
| Minus the heater, parts, labor and truck time for that job | −$600 |
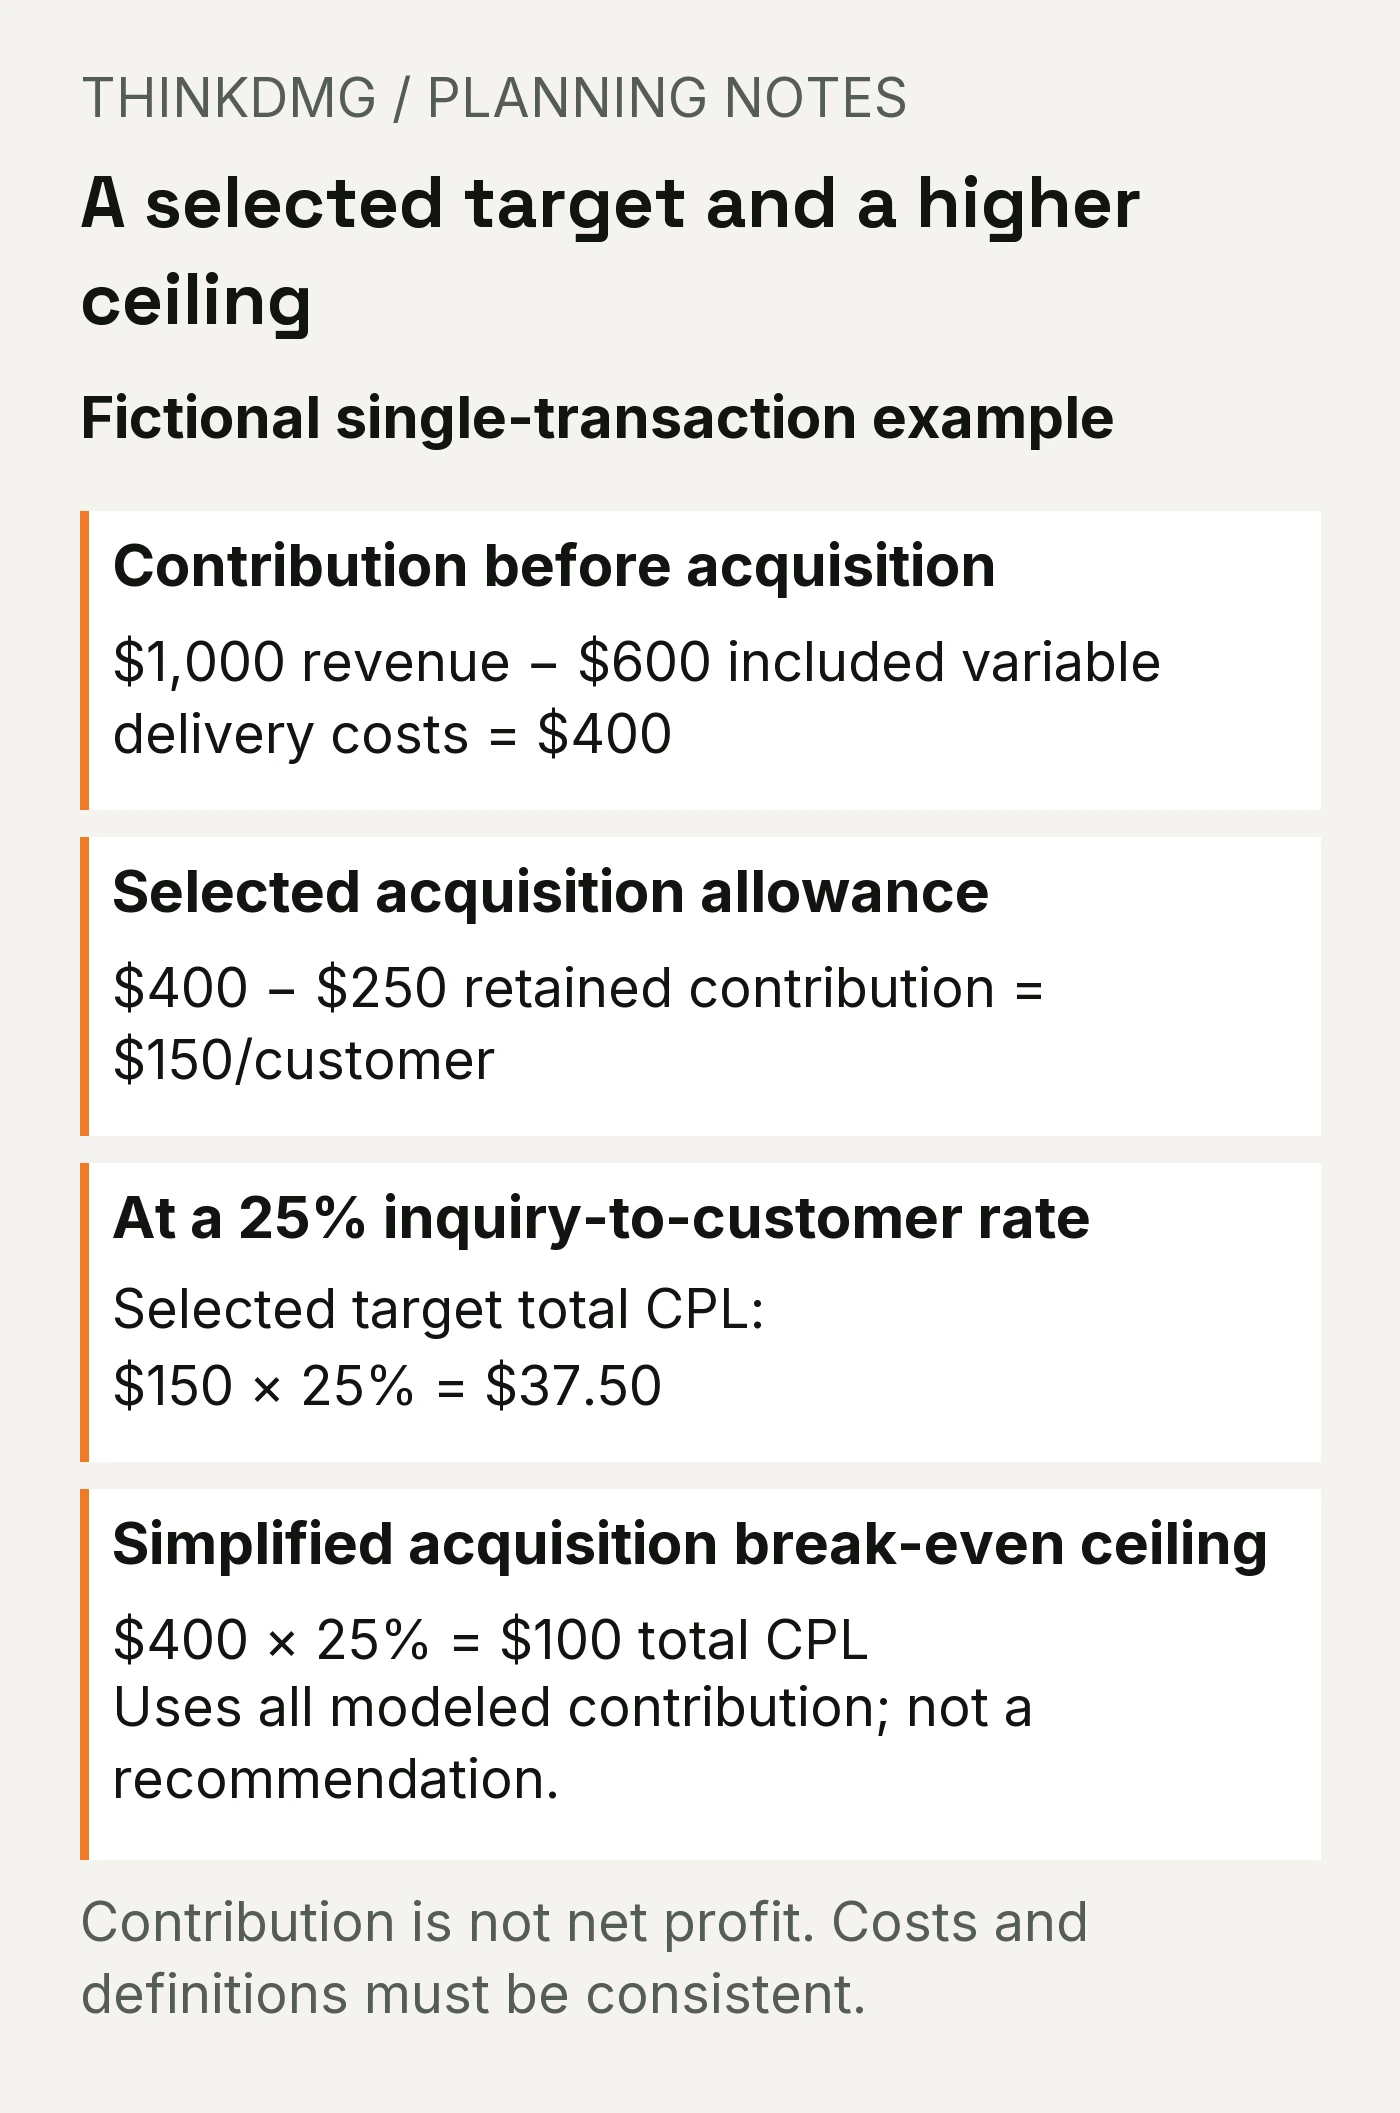
| What’s left after doing the job | $400 |
That $400 is what the job actually leaves him to cover everything else: rent, insurance, the office, his own pay and marketing. Accountants call it contribution. It isn’t profit, because rent and insurance still have to come out of it.
Step 2: Decide how much of that you need to keep
He can’t spend all $400 winning the customer. He’d have nothing left for rent, insurance or himself.
He decides he needs to keep $250 from each job for those costs. That leaves $150 he can spend to win each customer.
| Amount | |
|---|---|
| What’s left after the job | $400 |
| What he keeps for overhead and pay | −$250 |
| What he can spend to win a customer | $150 |
The $250 is his choice, based on his own books. It isn’t an industry rule. A business with higher overhead would keep more and spend less.
Step 3: Turn that into a price per lead
Not every lead becomes a customer. From his records, about 1 in 4 of his water heater leads book the job. That’s a 25% close rate.
If he can spend $150 to win a customer, and it takes about 4 leads to win one:
$150 × 25% = $37.50 per lead
That’s his target: the most he should pay per lead and still keep the $250 he needs from every job.
Step 4: Know your target and your ceiling
There’s a second number worth knowing: the absolute most he could pay before a new customer earns him nothing at all.
If he spent the whole $400 left from the job on winning the customer:
$400 × 25% = $100 per lead
That’s his ceiling. Pay that and every new customer covers its own marketing, with nothing left over for rent or pay.
| Per lead | What it means | |
|---|---|---|
| Target | $37.50 | He keeps $250 from every job for overhead and pay |
| Ceiling | $100 | He breaks even on the job and keeps nothing |
So back to his two offers:
- The $25 lead source is under his target. Worth trying, as long as those leads close as well as his others.
- The $45 lead source is over his target but under his ceiling. He’d still win jobs, but each one would leave him $220 instead of $250. Only worth it if those leads close better.
What if your close rate changes?
Your close rate moves your number more than anything else. Here’s how much:
| If 1 in… leads become customers | Close rate | Target per lead (keeps $250) | Ceiling per lead (keeps $0) |
|---|---|---|---|
| About 7 | 15% | $22.50 | $60 |
| 4 | 25% | $37.50 | $100 |
| About 3 | 35% | $52.50 | $140 |
Fictional numbers, not forecasts or industry benchmarks.
Getting better at following up raises the price you can afford for a lead. Going from 15% to 35% more than doubles his target. That’s why fixing your follow-up often beats hunting for cheaper leads. See our guide to getting leads but no customers.
Is that $30 lead really $30?
Ad platforms show you the ad cost per lead. But leads cost you more than the ad.
Say Example Plumbing’s Google Ads show $30 per lead across 40 leads a month. That’s $1,200 in ad spend. He also pays $400 a month for management and $50 for call tracking software.
| Monthly | Per lead (40 leads) | |
|---|---|---|
| Ad spend | $1,200 | $30.00 |
| Management fee | $400 | $10.00 |
| Call tracking software | $50 | $1.25 |
| Total | $1,650 | $41.25 |
The dashboard says $30, under his $37.50 target. The real cost is $41.25, over it.
Neither number is wrong. Just compare like with like: if your target includes every cost of winning a customer, compare it with the total cost per lead, not the ad cost alone. Our checklist of marketing costs besides advertising helps you find them all.
Match leads to when they actually close
Many jobs don’t close the same week the lead comes in. A water heater that fails gets replaced in days. A bathroom remodel might take two months to decide.
If you divide this month’s customers by this month’s leads, you can get the wrong close rate:
- A slow month for leads can look like a great close rate, because older leads are finally booking.
- A busy month can look terrible, because the new leads haven’t decided yet.
The fix: track each month’s leads as a group and check later how many of that group became customers. Leave leads that are still deciding open instead of counting them as lost.
Google’s own lead tracking draws the same line. It separates qualified leads, which you’ve vetted outside the ad platform, from converted leads, which have reached a step you define, such as a sale. Your close rate should come from the converted ones.
What about repeat customers?
Some customers come back. If a water heater customer also books a yearly flush, that customer is worth more than one job.
But be careful. Future visits aren’t money in the bank today. Some customers move, switch companies or never call again.
Start with what one job leaves you, like the worked example above. Then run a second scenario that includes repeat business, using numbers from your own records. Compare the two. Don’t quietly build optimistic repeat business into your main number.
How your number changes by industry
The method works the same for any business. The inputs don’t.
| Type of business | What usually changes |
|---|---|
| Emergency home services (plumbing, HVAC repair) | Jobs often close fast, so close rates are easier to measure month to month |
| Larger home projects (remodels, roofing) | Bigger jobs, longer decisions; track leads by month and wait for them to close |
| Appointment businesses (dental, medical, salons) | Repeat visits matter more; keep the one-visit number and the repeat scenario separate |
| Professional services (legal, accounting) | Job values vary widely; work out a number for each main service, not one average |
This table describes how the inputs differ, not typical values. Use your own records for every number.
Example Plumbing’s completed worksheet
| Line | Example Plumbing |
|---|---|
| What a typical job brings in | $1,000 |
| Cost of doing that job | $600 |
| What’s left after the job | $400 |
| What he keeps for overhead and pay | $250 |
| What he can spend to win a customer | $150 |
| Close rate (water heater leads) | 25% |
| Target per lead | $37.50 |
| Ceiling per lead | $100 |
| Current total cost per lead (ads + fee + software) | $41.25 |
| Decision | Slightly over target. Improve follow-up or trim costs before adding budget. |
What we check first
Here’s our approach at ThinkDMG. Before we tell a business whether a lead source is worth it, we check three things:
- Do they know their close rate from their own records? If not, we start by tracking it, because every other number depends on it.
- Are they comparing ad cost or total cost? A lead source that looks cheap on ad cost alone can be over target once fees are included.
- Is the close rate from the same kind of lead? Referral leads and ad leads rarely close at the same rate.
Five lead cost mistakes
| Mistake | What it costs you | The fix |
|---|---|---|
| Chasing the cheapest leads | Lots of inquiries, few jobs, a busy office | Judge lead sources by cost per customer, not cost per lead |
| Using revenue instead of what the job leaves you | You think you can afford two or three times what you really can | Subtract the cost of doing the job first |
| Comparing ad cost to a total-cost target | A lead looks under budget when it’s really over | Include management, software and other costs |
| Using the wrong close rate | Your target is too high or too low | Use the close rate for the same kind of lead |
| Counting this month’s leads against this month’s sales | Close rates swing wildly month to month | Track each month’s leads as a group until they decide |
Your blank lead cost worksheet
Fill this in, or let the Lead Cost Calculator do the math.
| Line | Your number |
|---|---|
| What a typical job brings in | |
| Cost of doing that job (materials, labor, other job costs) | |
| What’s left after the job | |
| What you need to keep for overhead and pay | |
| What you can spend to win a customer | |
| Your close rate (from your own records) | |
| Target per lead (spend to win × close rate) | |
| Ceiling per lead (what’s left × close rate) | |
| Your current total cost per lead |
What to do next
Now that you know what a lead is worth, work out how many leads you need to hit your customer goal. If your real cost per lead is over your target, the cheapest fix is usually after the click: check your landing page and your follow-up before you cut the budget.
When should you ask a marketing agency for help?
You can do this math yourself. Get a second set of eyes if:
- You don’t know your close rate and aren’t sure how to track it
- Different lead sources quote different prices and you can’t compare them
- Your ad dashboard shows one cost per lead and your bank statement suggests another
- You’re paying for leads that rarely turn into jobs
- You want to grow but aren’t sure how much you can afford to spend
Digital Marketing Group works with home services and local businesses across South Jersey and Greater Philadelphia on paid advertising built around what a customer is actually worth to you.
Frequently asked questions
How much should I pay per lead?
Work it out from your own numbers: what a job leaves you after its costs, minus what you need to keep for overhead and pay, multiplied by the share of leads that become customers. In our fictional plumbing example, that comes to $37.50 per lead.
Is the lowest cost per lead always the best?
No. A cheap lead that rarely becomes a customer can cost more per job than a pricier lead that closes often. Compare lead sources by cost per customer, using each source’s own close rate.
What if I don’t know my close rate?
Run two or three “what if” rates and label them as guesses. Then start tracking every lead and what happened to it. Within a month or two you’ll have a real number to work with.
Should I include my agency fee in cost per lead?
If your target is meant to cover every cost of winning a customer, yes. Compare your target with the total cost per lead, including ad spend, management fees and software, not the ad cost alone.
What’s the difference between the target and the ceiling?
The target is what you can pay per lead and still keep the amount you need from each job. The ceiling is the most you could pay before a new customer leaves you nothing. Aim for the target. Treat the ceiling as the line you never cross.
Sources
- Google Ads Help: About qualified and converted leads. Defines qualified leads as leads vetted outside Google Ads, such as in a CRM, and converted leads as leads that reach a step you define, such as a sale.
About the numbers: Example Plumbing and every figure in this article are fictional, used to show the method. They are not benchmarks or ThinkDMG client results.
