
A sales rep tells you most businesses spend 8% of revenue on marketing. You do the math on your own revenue, and the number feels either way too high or suspiciously low.
Both reactions make sense. That 8% comes from surveys of much bigger companies, and it knows nothing about your rent, payroll or slow months. Sign a budget built on it and you either starve your marketing or spend money you need for March payroll.
There is a better starting point, and all you need is last month’s numbers.
Quick answer
Start with what your business can afford: monthly revenue, minus operating costs, minus the cash you want to keep. That is your ceiling. Then compare it with what your goal needs. Percent-of-revenue figures (5% to 8% in recent surveys) describe mostly large companies, so use them as a sanity check, not a target.
The method is ThinkDMG’s recommendation. The survey figures are sourced below.
Where the “percent of revenue” numbers come from
You will see 5%, 7.8% and “7 to 8% per the SBA” all over the internet. We went to the original sources to see who those numbers actually describe.
| Source | What it says | Who it describes |
|---|---|---|
| Gartner CMO Spend Survey, 2026 | Marketing budgets average 7.8% of company revenue (7.7% in 2025) | 401 marketing leaders in North America, the UK and Europe, surveyed January to March 2026. Most work at companies with more than $1 billion in annual revenue. |
| The CMO Survey, 2026 | Marketing averages 8.96% of revenue. The median company spends 5%. | Senior marketing leaders at U.S. for-profit companies, surveyed in January 2026. 154 answered this question. |
| U.S. Small Business Administration, marketing and sales guide | No percentage. It tells owners to list every marketing cost and compare costs with the revenue they bring in. | Small business owners writing a marketing plan |
Two things jump out. First, the best-known figure comes mostly from billion-dollar companies with full marketing departments. Second, the “SBA says 7 to 8%” line you see on agency sites is not on the SBA’s own marketing guide. We checked.
Plain English: average vs. median
The average adds everyone up and divides. A few big spenders pull it up. The median is the company in the middle of the line. When the average is 8.96% and the median is 5%, the typical company spends closer to 5%.
Now compare that with who runs businesses around here. New Jersey has about 1.1 million small businesses, and they make up 99.7% of all businesses in the state, according to the SBA Office of Advocacy’s 2025 New Jersey profile. That count uses 2022 Census data and defines “small” as fewer than 500 employees. The typical company in those surveys is not the typical South Jersey business.
The safer starting point: the cash you can keep
Instead of starting with a percentage, start with your own month. This is the method ThinkDMG recommends.
- Put everything on a monthly basis. Divide annual bills by 12. Use money actually collected, not invoices sent.
- Subtract operating costs from revenue. Include your own pay, rent, payroll, loan payments, taxes you set aside and any marketing you already pay for.
- Subtract the cash you want to keep. This is your cushion for slow months, repairs and surprises. Decide it before you look at any proposal.
- What’s left is new room for marketing. Add back the marketing already inside your costs, and you have your total marketing ceiling.
Your bookkeeper or accountant can check these numbers against your actual cash flow in one short conversation. It is worth the call.
Worked example: Example Grooming Co. in Collingswood
Example Grooming Co. is fictional: the business, its owner and every number. It’s here to show the method, not to predict your results.
Example Grooming Co. is a two-table dog grooming shop in Collingswood, Camden County. The owner already spends $1,000 a month on a Google Business Profile manager and a few local ads. An agency has just sent her a $3,500-a-month proposal.
She pulls last month’s numbers:
| Monthly figure | Amount |
|---|---|
| Revenue collected | $20,000 |
| Operating costs, including her current $1,000 of marketing | $15,000 |
| Cash she wants to keep each month | $3,000 |
| Marketing already inside operating costs | $1,000 |
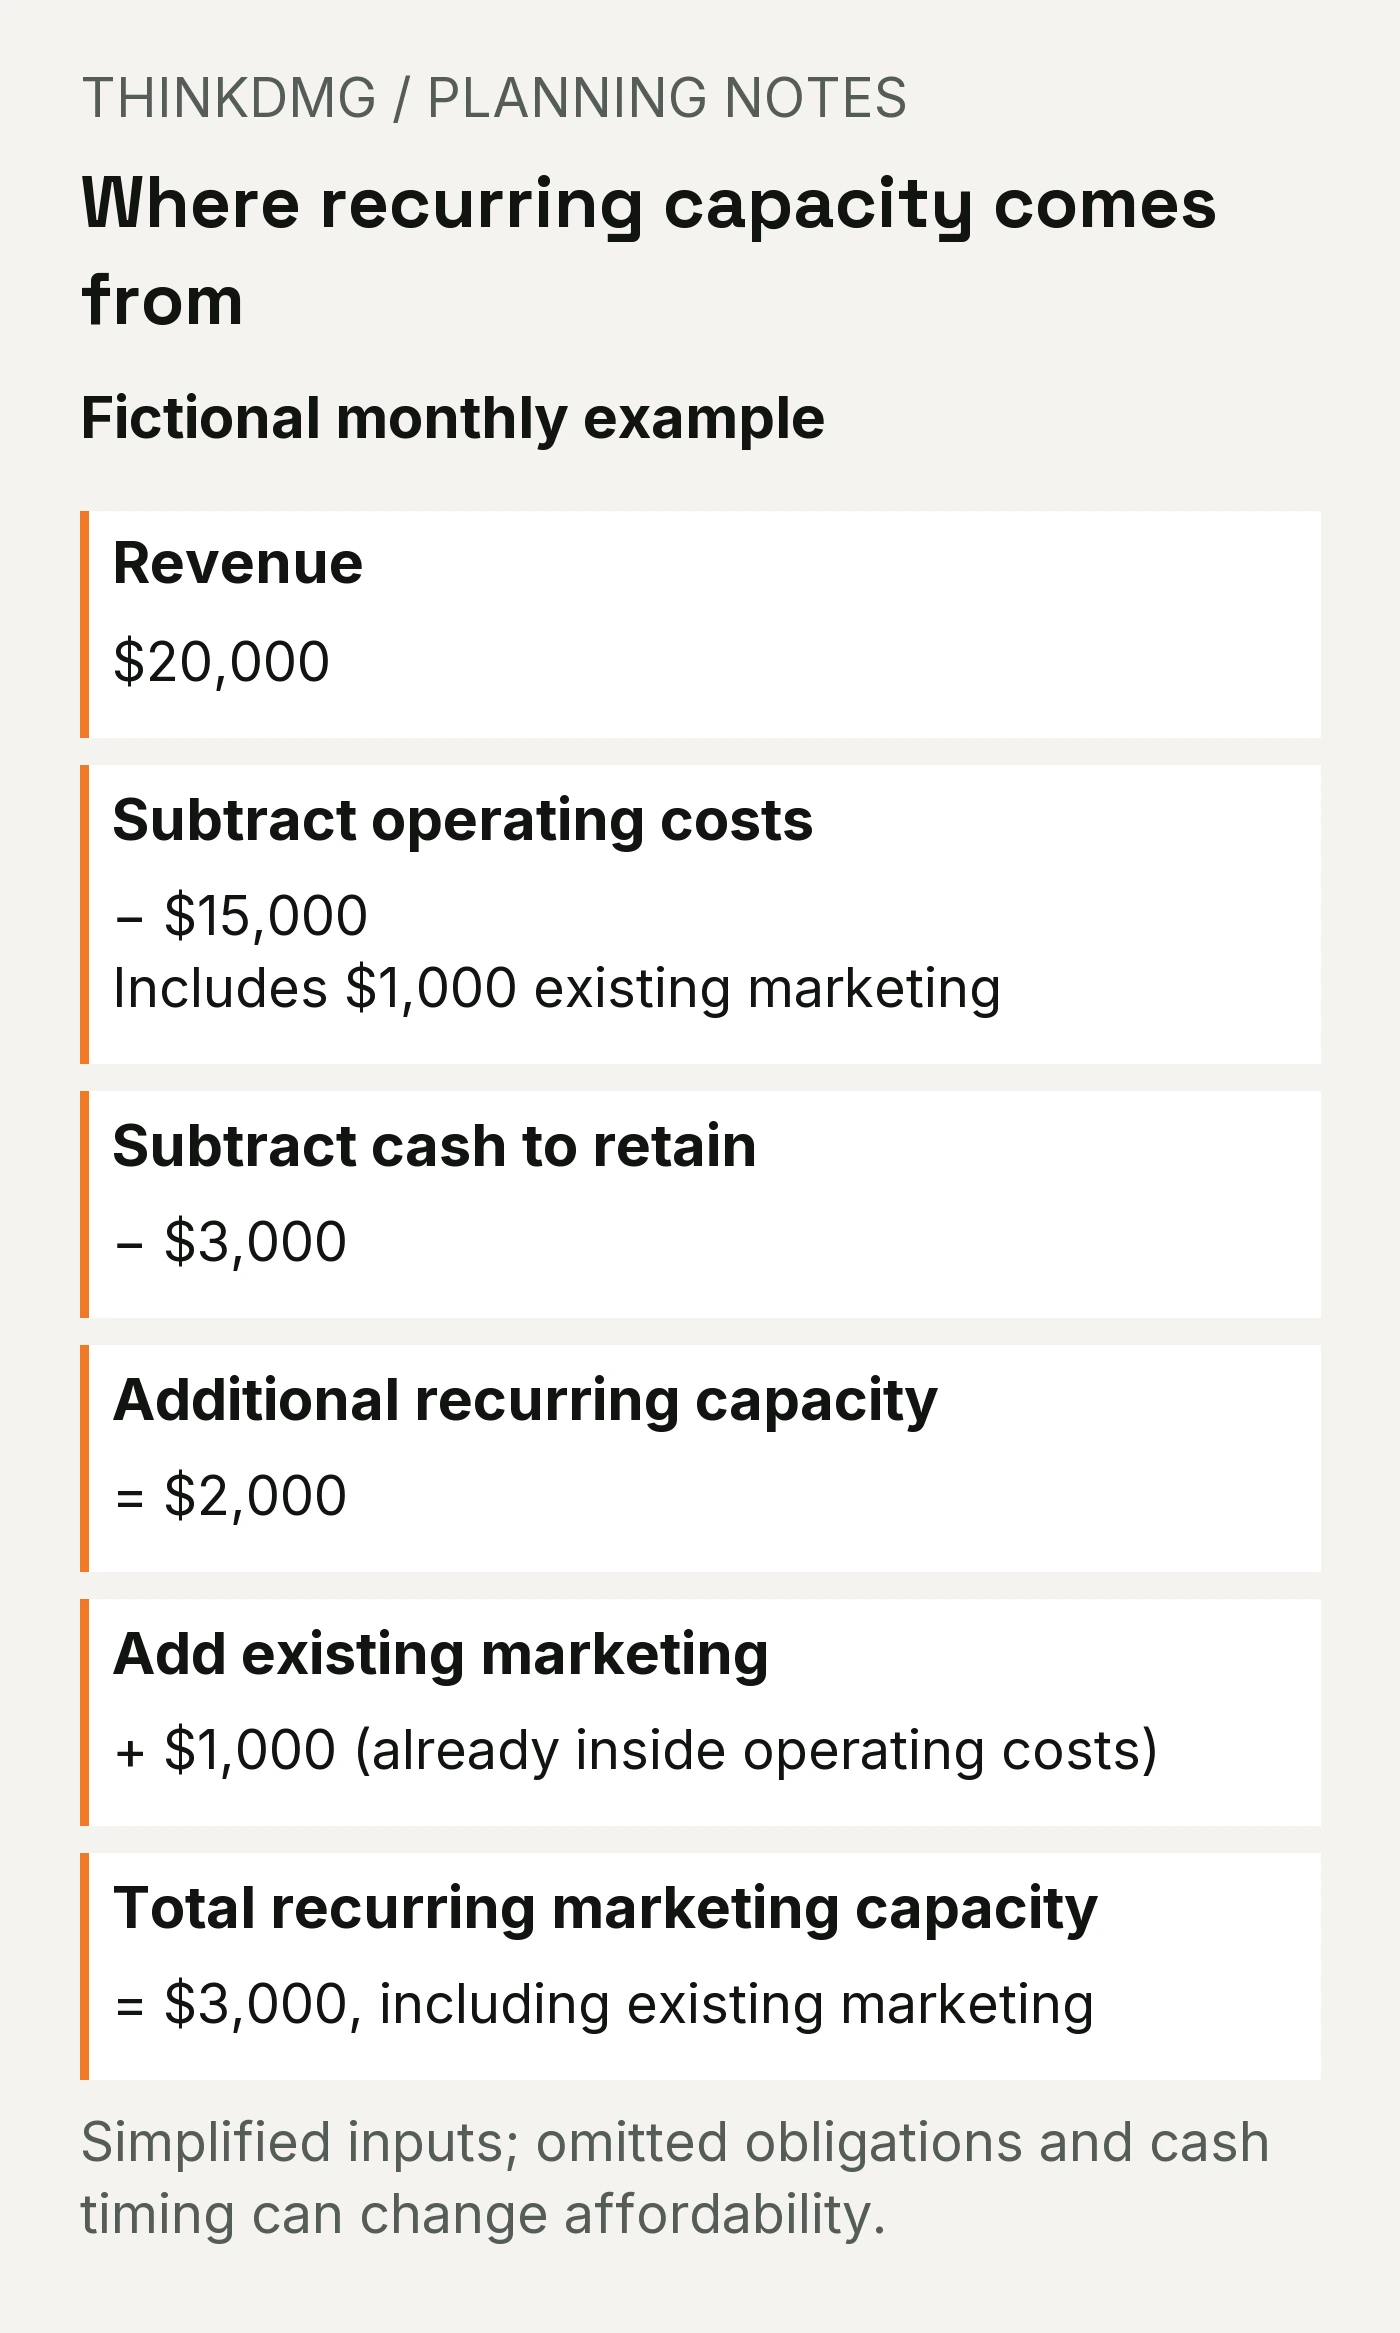
The math:
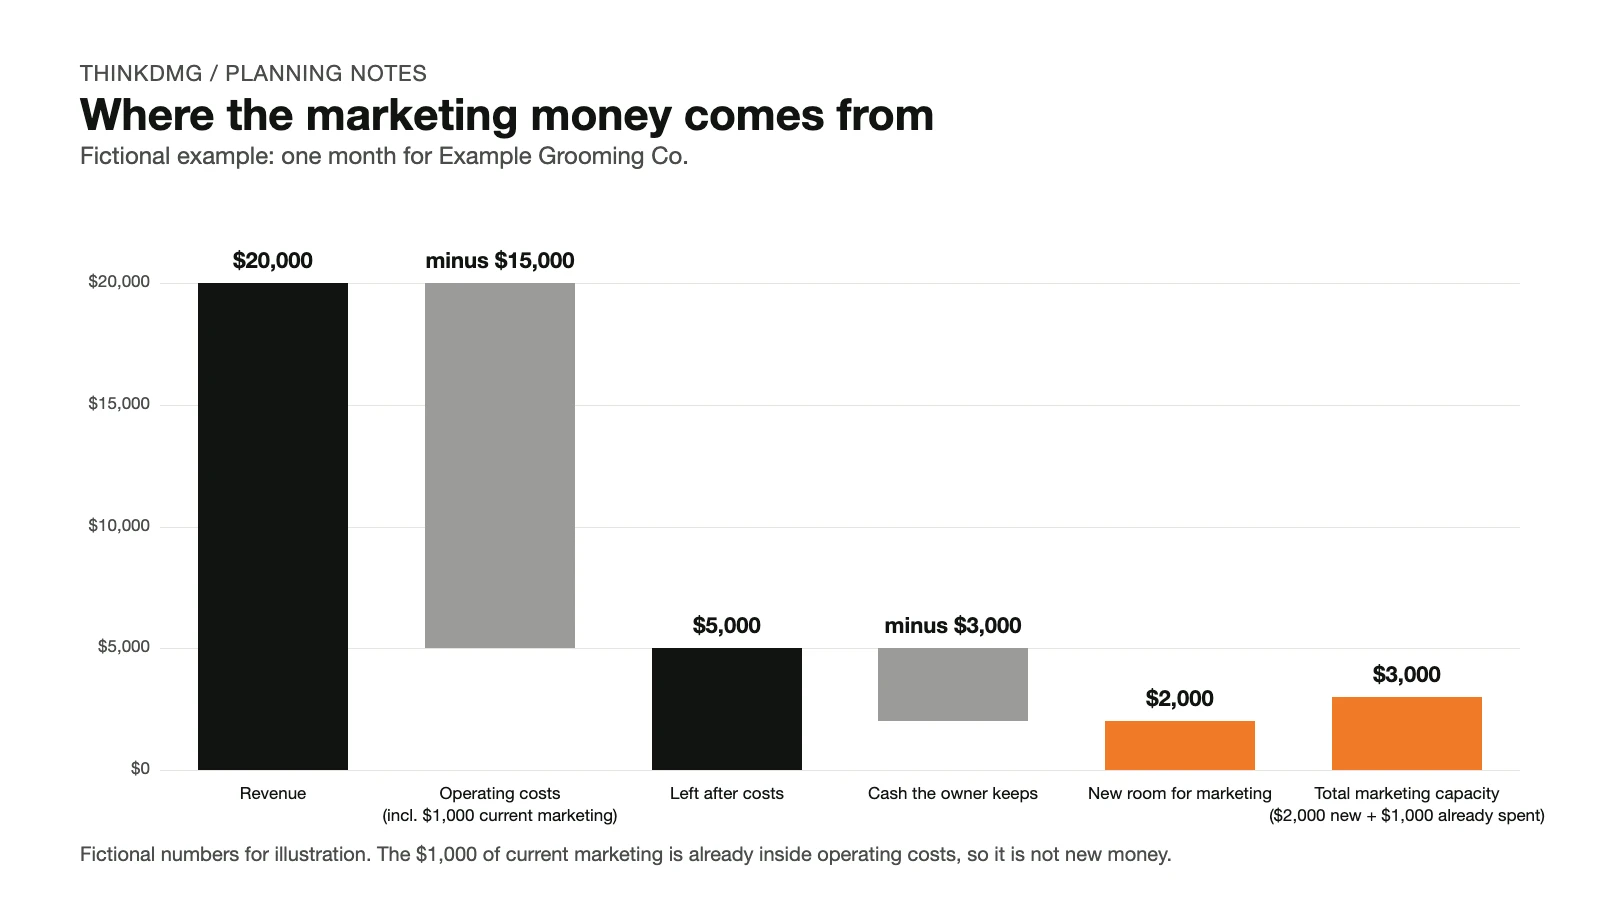
- $20,000 revenue minus $15,000 costs = $5,000 left
- $5,000 minus the $3,000 she keeps = $2,000 of new room
- $2,000 new room plus the $1,000 she already spends = $3,000 total marketing ceiling
That last step is where owners slip. She does not have $3,000 on top of what she spends now. She has $3,000 in total, and $1,000 of it is already going out the door.
The twist: what the percentages would have told her
Here is the same business run through the survey numbers instead:
| Method | Math on $20,000 revenue | Monthly marketing |
|---|---|---|
| CMO Survey median | 5% × $20,000 | $1,000 |
| Gartner average | 7.8% × $20,000 | $1,560 |
| CMO Survey average | 8.96% × $20,000 | $1,792 |
| Her own cash | $20,000 − $15,000 − $3,000 + $1,000 | $3,000 ceiling |
| The agency proposal | $3,500 ÷ $20,000 | 17.5% of revenue |
The percentages would have kept her at $1,000 to $1,800. Her own numbers show she can afford up to $3,000. And the $3,500 proposal is over her ceiling no matter which method she uses.
A ceiling is not a target, though. Affording $3,000 doesn’t mean she should spend $3,000. That depends on what her goal needs, which the next sections cover.
Test any proposal against your ceiling
With a ceiling in hand, checking a proposal takes one line of math. Compare the proposal’s total monthly cost (ads, management, setup spread out, tools) with your ceiling.
| Proposal (total per month) | Her $3,000 ceiling | Result |
|---|---|---|
| $2,500 | $500 under | Fits, with $500 to spare for surprises |
| $3,500 | $500 over | Doesn’t fit unless something else changes |
When a proposal is over, don’t close the gap by assuming the campaign will bring in new revenue fast. If the plan only works when sales show up on schedule, say that out loud and decide what happens if they show up late.
Before you compare totals, make sure each proposal counts the same things. A plan quoting “$1,000 in ads” can easily cost twice that once management, pages and tracking are added. Our guide to what a marketing budget should include besides ad spend has the full list.
Questions to ask whoever sent the proposal
Ask: “What is the total I will pay each month, including your fee, ad spend, setup and any tools?”
A clear answer sounds like: “$2,800 a month: $1,500 in ads, $1,000 management, $300 for call tracking and landing page hosting. Setup is $900 once.”
Ask: “Which of these costs keep going if we pause the ads?”
A clear answer sounds like: “The tracking and hosting stay at $300. Everything else stops.”
Ask: “What would you cut first if I can only do $2,500?”
A clear answer sounds like: a specific line item, not “we can’t go lower.”
What if your seasons swing?
Lots of South Jersey businesses don’t have a “normal” month. A Gloucester County landscaper earns most of its money from April to October. A shore rental company in Cape May County lives on summer. (Both are examples, not data.)
For a seasonal business, run the math on your slowest typical month, or on a 12-month average if you have the cash to carry the slow months. Then decide whether marketing spend should rise and fall with the season. One option worth weighing: start a few weeks before the busy season, while customers are still planning.
What if the number comes out negative?
Then your business can’t afford new recurring marketing right now, and the honest answer is to not add any. That’s not a judgment on your business. It’s a cash-flow fact for this month.
Here is what to do instead:
- Check the inputs first. A one-time repair or annual insurance bill counted as monthly can make a healthy month look negative.
- Don’t cut everything at once. Look at what your current marketing actually produces. Keep what brings in paying customers.
- Use the free basics. Creating a Google Business Profile and listing your business on Google is free, according to Google. Asking happy customers for reviews and referrals costs nothing.
- Fix the cost or price problem. If the math is negative every month, the bigger issue is pricing or costs, not marketing. Talk to your accountant.
What happens when grant or test money runs out
Sometimes there is extra money for a while: a grant, a slow-season reserve or a “let’s try this for three months” fund. It feels like a bigger budget. It’s actually a bigger budget with an end date.
Fictional example, continued. Say Example Grooming Co. keeps its $3,000 monthly ceiling and also sets aside a separate $3,000 to test a new campaign for three months.
- $3,000 test fund ÷ 3 months = $1,000 extra per month
- During the test she can afford $3,000 + $1,000 = $4,000 a month
- She picks a plan that costs $3,500 a month

For three months she has a $500 cushion. In month four the test money is gone, her ceiling drops back to $3,000 and the same plan is $500 over.
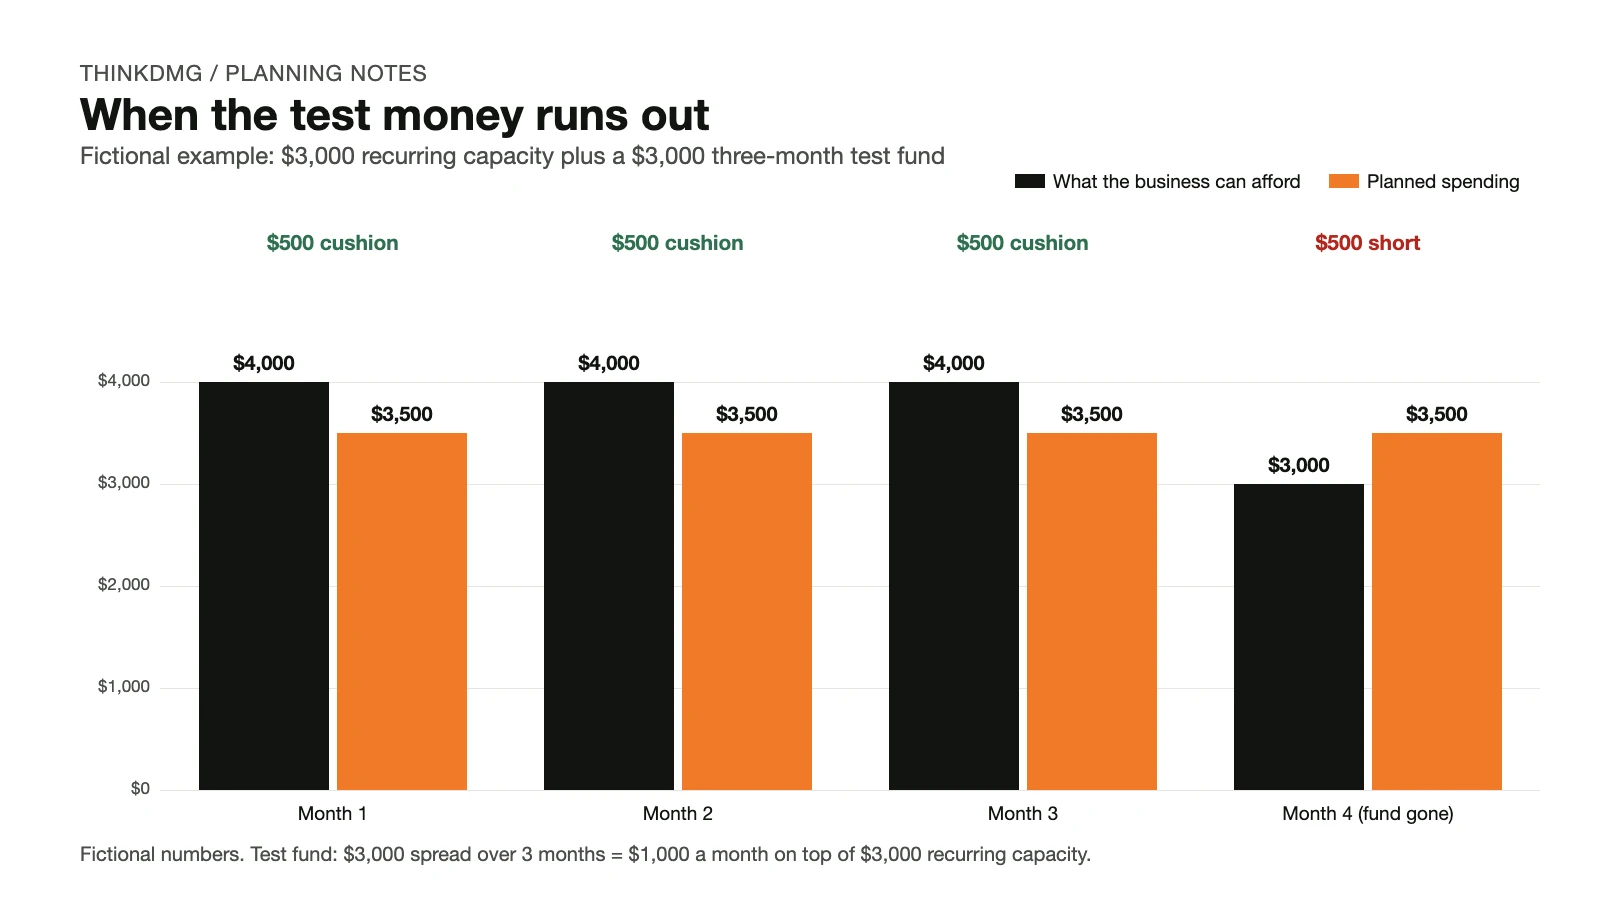
That shortfall is just arithmetic, not a prediction. A campaign that works can raise revenue enough to cover it. One that doesn’t will leave the gap in place. So decide what month four looks like before the test starts.
Write down your month-four decision now
Before launch, agree on what counts as a real lead and how you’ll know which leads became paying customers. Google Ads itself separates leads into “qualified” (checked and interested) and “converted” (became a sale), as its lead measurement guide explains. Track at least that much.
Then pick one of three outcomes for month four:
| Decision | When it makes sense | What to write down |
|---|---|---|
| Continue | The test produced paying customers and your updated cash numbers cover the plan | The new ceiling and the new monthly cost |
| Adjust | You can name one specific problem and afford a short, capped second round | What changes, the new end date and the spending cap |
| Stop or pause | It doesn’t fit, tracking couldn’t tell you what happened, or results didn’t justify more | Contract notice periods and costs already committed |
One more trap: booked work is not cash in the bank. If customers pay after the job is done, you are funding the work before the money arrives. Plan for that gap.
To design the test itself, read how to A/B test a marketing campaign without wasting budget.
From “what I can afford” to “what I should spend”
Your ceiling is step one of four. Each step checks the one before it.

- What can you afford? This guide.
- How many leads do you need? Work backward from your customer goal in how many leads you need.
- What can each lead cost? Find your limit in how much you can afford to pay for a lead.
- What does the full plan cost? Add every line in what a marketing budget includes besides ads.
If leads × cost per lead + everything else fits under your ceiling, go. If not, adjust the goal, the timeline or the plan before you sign. Not sure where to put the money once you have a number? Read SEO, Google Ads or social media: which to start with.
Your monthly marketing ceiling worksheet
Fill this in with last month’s numbers, or a typical slow month if your business is seasonal.
| Line | Your number |
|---|---|
| A. Revenue collected this month | $ |
| B. Operating costs, including your pay and current marketing | $ |
| C. Cash you want to keep each month | $ |
| D. New room for marketing (A − B − C) | $ |
| E. Marketing you already pay for (inside B) | $ |
| F. Total marketing ceiling (D + E) | $ |
| G. Any temporary money (grant, test fund) per month, and its end date | $ until |
| H. Total monthly cost of the proposal you’re considering | $ |
| I. Fits? (H under F, without counting G) | Yes / No |
If D is negative, read the section on negative numbers above before you go further.
What to do this week
- Pull last month’s revenue collected and total costs. Annual bills go in at one-twelfth.
- Decide how much cash you want to keep each month. Write it down before you look at proposals.
- Fill in the worksheet above. Circle line F.
- Ask anyone proposing a budget for the total monthly cost, with every line listed.
- If you have temporary money, write your month-four decision today.
Free tool: find your monthly marketing ceiling
Enter your revenue, costs and the cash you want to keep. The Marketing Budget Planner shows what you can spend each month and keeps any test money separate, so a short trial doesn’t turn into a permanent bill. No account needed.
Questions owners ask about marketing budgets
Is 10% of revenue too much to spend on marketing?
Not automatically. It depends on your margins and your cash. Ten percent of revenue for a business with thin margins can be impossible. For a business with high margins and lots of room, it can be modest. Run the ceiling math and let that answer it.
Should a new business spend more on marketing?
A new business has to get known, but it also has the least cash. If you’re borrowing or using savings to fund marketing, treat that money like a test fund: set an amount, an end date and what you need to see before spending more.
Does my marketing budget include my website?
Yes. Website hosting, updates and new landing pages are marketing costs. A one-time website build can be spread across the months it serves for planning, but remember you still pay the bill when it’s due.
How often should I redo this math?
Quarterly is a good habit, and any time revenue or costs change a lot. Seasonal businesses should do it before each busy season.
Can I count my own time as a marketing cost?
Track it, but separately. If you spend five hours a week on social media, that time has value. It isn’t a new bill, though, so don’t subtract it from your cash twice.
Next step: a free First-Dollar Review
Bring your filled-in worksheet, last month’s profit and loss statement, and any proposals you’re weighing. In a free First-Dollar Review (our free marketing consultation), ThinkDMG will tell you whether those proposals fit your ceiling and which part of the plan should get your first dollar. Request your First-Dollar Review.
Sources
- Gartner: 2026 CMO Spend Survey press release (May 11, 2026). Marketing budgets 7.8% of company revenue; 401 respondents; January to March 2026; most over $1 billion revenue; North America, UK and Europe.
- The CMO Survey: Topline Report 2026. Marketing expenses as a percent of company revenues: mean 8.96%, median 5%, 154 valid answers. U.S. for-profit companies, fielded January 2026.
- U.S. Small Business Administration: Marketing and sales. Advises a full cost breakdown and comparing marketing costs with revenue. Gives no percentage.
- SBA Office of Advocacy: New Jersey 2025 Small Business Profile. About 1.1 million small businesses, 99.7% of New Jersey businesses. Based on 2022 Census data; small means fewer than 500 employees.
- Google: Business Profile. Creating a Business Profile and listing on Google is free.
- Google Ads Help: About qualified leads and converted leads.
About the numbers: Example Grooming Co. and every figure in its example are fictional. The percentages in the comparison table are real survey figures applied to fictional revenue.
